
Disclaimer: This article is for informational purposes only. Smart home devices involve electrical connections and data privacy. Always follow manufacturer instructions for installation. For complex wiring or HVAC work, consult a licensed professional.
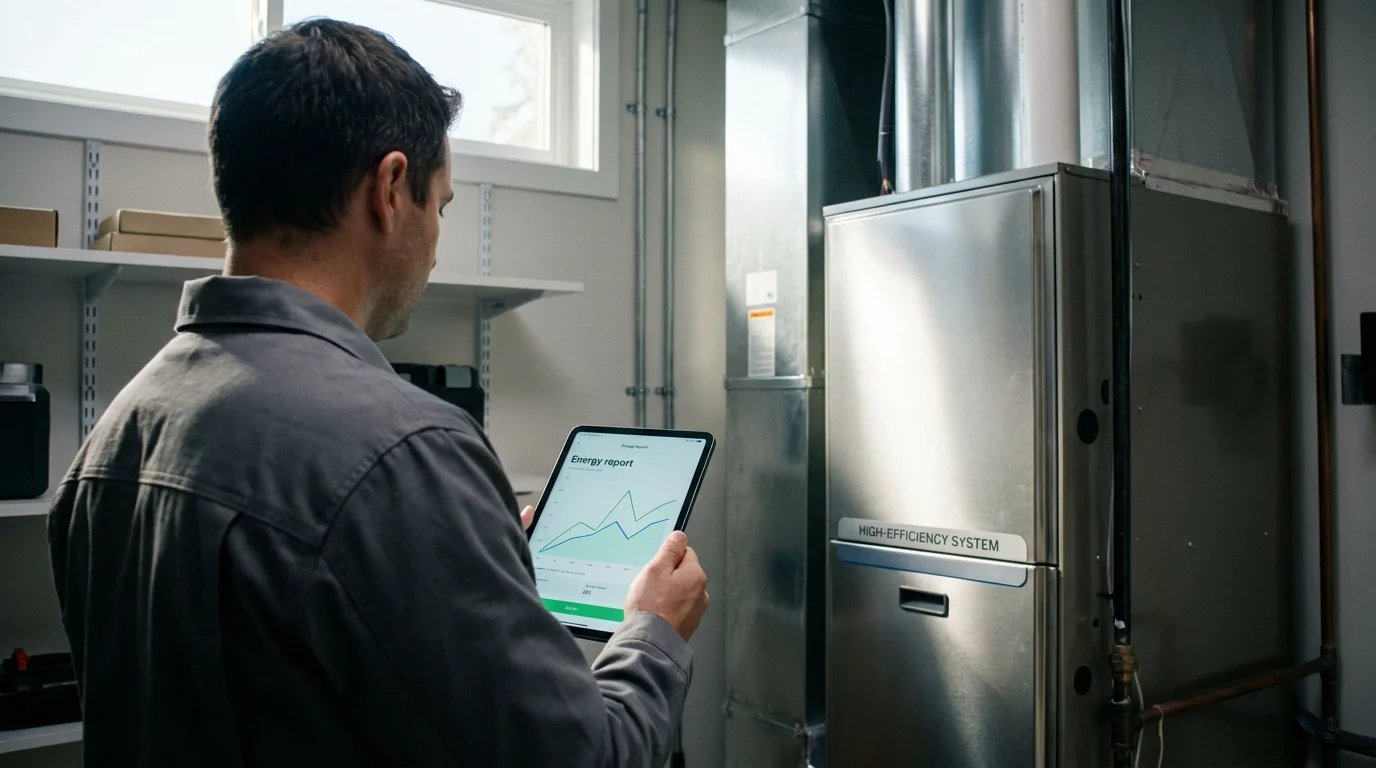
Your smart thermostat does more than just control your home’s temperature; it also collects valuable information about your heating and cooling patterns. These detailed energy reports provide insights into your home’s efficiency, helping you identify opportunities to save money and reduce your environmental footprint. Understanding this data transforms your thermostat from a simple controller into a powerful analytical tool.
We will guide you through decrypting these reports, showing you what key metrics to look for, how different brands present their data, and practical steps you can take to optimize your home’s energy consumption based on the usage data your thermostat provides.

Why Your Smart Thermostat’s Energy Reports Matter
Smart thermostats provide an incredible advantage over traditional models: they offer transparency into your home’s energy consumption. This transparency empowers you to make informed decisions about your heating and cooling habits. You gain a clear picture of when and how your HVAC system operates, allowing you to fine-tune settings for maximum efficiency.
Accessing and interpreting this data helps you achieve significant savings. You might discover that certain times of day or specific temperature settings lead to disproportionately high energy use. Adjusting these habits directly translates into lower utility bills and a more sustainable home.
The best smart home is the one you don’t have to manage; it’s the one that manages itself efficiently and provides the data you need to ensure it’s working for you.
Understanding thermostat usage data also contributes to a more comfortable living environment. By analyzing trends, you pinpoint periods of inefficiency that might correlate with uncomfortable temperatures. You optimize your system’s performance, ensuring consistent comfort without unnecessary energy waste.

Core Metrics You Will Find in Your Energy Reports
While specific dashboards vary by manufacturer, all smart thermostats deliver similar core metrics. Recognizing these fundamental data points is your first step toward effective consumption analysis. These metrics paint a comprehensive picture of your HVAC system’s activity and your home’s thermal performance.
Keep in mind that learning how to use room sensors for better temperature control can significantly enhance the granularity of these core metrics.
Look for these essential data elements in your thermostat’s reports:
- Run Time: This metric shows how long your heating or cooling system actively operated. High run times often indicate poor insulation, leaky windows, or inefficient scheduling.
- Temperature Setpoints: Your report details the temperatures you set throughout the day. This helps you correlate specific setpoints with energy usage spikes.
- Achieved Temperatures: This tracks the actual indoor temperature, showing how effectively your system met your setpoints. Significant discrepancies might signal an undersized HVAC unit or poor thermostat placement.
- Outside Temperature: Many smart thermostats integrate local weather data. Comparing indoor system activity to outdoor conditions provides crucial context for your energy consumption.
- Humidity Levels: Both indoor and outdoor humidity affect comfort and perceived temperature. Your reports often show these levels, especially if your system has a dehumidification feature.
- Scheduled vs. Manual Adjustments: This differentiates between automated adjustments from your schedule or geofencing and direct changes you made. It highlights how effectively your programmed schedules meet your needs.
- Energy Star Savings (Estimated): Some reports estimate the energy you saved compared to a baseline or average similar home. This provides a tangible measure of your efficiency efforts.
Each of these metrics plays a role in your overall energy reports. Pay attention to how they interact. For instance, high run times on a mild day might indicate an issue, while similar run times on an extremely hot or cold day are expected.

How Different Brands Present Usage Data
While the underlying data is similar, smart thermostat manufacturers each have unique ways of presenting their usage data. Familiarizing yourself with your specific thermostat’s interface is crucial for effective how to read smart thermostat energy report understanding.
To see which platform offers the interface you prefer, check out our comparison of Nest vs Ecobee vs Honeywell.
Nest Thermostats: The Home Report and Energy History
Nest thermostats, like the Nest Learning Thermostat and Nest Thermostat E, provide a “Home Report” or “Energy History” within the Google Home app. This report typically visualizes your heating and cooling patterns on a daily, weekly, or monthly basis.
- Daily Overview: You will see a timeline graph showing when your system ran, indicated by color-coded bars (e.g., orange for heating, blue for cooling). It often overlays your set temperature and the outdoor temperature.
- Detailed Metrics: Nest reports highlight key actions, such as when you manually adjusted the temperature, when the system switched modes, and if features like Home/Away Assist or Eco Temperatures engaged.
- Savings Estimates: Nest often quantifies estimated savings, indicating “Leaf” awards for efficient days and offering personalized tips based on your usage.
For example, your Nest report might show your furnace ran for 8 hours on a specific winter day, primarily between 6 AM and 9 AM and again from 5 PM to 9 PM, aligning with your programmed schedule and indicating efficient operation during occupied hours.
Ecobee Thermostats: Home IQ
Ecobee thermostats, including the Ecobee SmartThermostat with Voice Control and Ecobee3 Lite, offer a robust “Home IQ” feature accessible via the web portal or the Ecobee app. Home IQ provides deep insights into your home’s thermal performance.
- System Monitor: This graph displays detailed run times for heating, cooling, and fan operation, often with lines for indoor and outdoor temperatures, humidity, and setpoints. You can zoom in on specific days or hours.
- Energy Savings: Ecobee presents an “Energy Savings” section that benchmarks your usage against similar homes and provides data on how features like Smart Away and Follow Me contribute to savings.
- Weather Impact: Ecobee’s reports clearly show the influence of outdoor temperatures on your system’s run times, helping you understand the real energy cost of extreme weather.
An Ecobee Home IQ report might reveal that your air conditioning cycles on and off every 15 minutes during the hottest part of the day, suggesting potential oversizing or insulation issues if the cooling cycles are very short but frequent.
Honeywell Home Thermostats: Usage Reports
Honeywell Home smart thermostats, such as the T9 and T10 Pro, provide usage reports through the Honeywell Home app. These reports focus on practical metrics to help you manage your comfort and efficiency.
- Daily/Weekly Usage: You will see graphs illustrating daily or weekly heating and cooling run times. Some models also show fan run time.
- Temperature History: The reports track your indoor temperature history against your setpoints, offering a visual representation of how well your system maintains desired temperatures.
- Event Log: Honeywell reports often include an event log, noting when your system turned on/off, when you changed the setpoint, or if any alerts occurred.
A Honeywell report might show increased heating usage on weekends compared to weekdays, indicating a potential for further schedule optimization if your weekend occupancy differs from your current programming.

Analyzing Your Consumption Patterns for Savings
After you locate and understand the individual metrics, the next step involves connecting these dots to perform a meaningful consumption analysis. This is where you identify actionable insights that lead to real energy savings.
Follow these steps to effectively analyze your energy reports:
- Identify Peak Usage Hours: Look for periods when your heating or cooling system runs most frequently or for the longest durations. Do these align with when you are home and need comfort, or are they occurring when the house is empty?
- Evaluate Your Schedules: Compare your actual system run times against your programmed schedule. Does your system consistently run outside of your programmed “comfort” periods? This could indicate a need to adjust your schedule. For instance, if your AC runs heavily an hour before you arrive home, consider shifting your “cool before arrival” setting.
- Assess the Impact of Geofencing: If you use geofencing, check if your system is switching to “Away” mode reliably when you leave and “Home” when you return. Inaccurate geofencing can lead to heating or cooling an empty house.
- Correlate with Outdoor Weather: Pay close attention to how your system responds to different outdoor temperatures. If your heating runs excessively on a relatively mild day, it might signal poor insulation or air leaks.
- Spot Unusual Spikes: Look for unexpected increases in run time or energy usage that do not align with weather changes or occupancy. These spikes could indicate a system malfunction, an open window, or an incorrectly set schedule.
For example, if your report shows high cooling run times every weekday afternoon while you are at work, you have an immediate opportunity. Adjust your “Away” temperature setpoint higher or ensure your geofencing is working correctly to avoid cooling an empty home. This direct feedback loop makes understanding thermostat usage data incredibly valuable.
Connecting Energy Reports to Your HVAC System Performance
Your thermostat’s energy reports offer more than just insights into your wallet; they also provide clues about the health and efficiency of your HVAC system. Interpreting these reports can help you identify potential issues before they become major problems, allowing for proactive maintenance.
Understanding Cycle Times
Efficient HVAC systems typically have relatively long and consistent cycle times. Your system should run long enough to achieve your set temperature, then shut off for a period. Short cycling, where the system frequently turns on and off in short bursts, often points to a problem.
- Short Cycles: If your reports show frequent, brief run times (e.g., 5-10 minutes every half hour), your system might be oversized, or you could have airflow issues. An oversized system cools or heats the space too quickly, satisfying the thermostat before properly conditioning the air.
- Long Cycles: Conversely, excessively long run times, where the system runs for hours without reaching the setpoint, might indicate an undersized system, a clogged filter, a refrigerant leak, or poor insulation.
By regularly reviewing your usage data, you can spot these patterns and address them. If your Nest report shows consistent short cycling, for instance, consider having an HVAC technician assess your system’s sizing and air balancing.
Detecting Airflow Issues
A significant discrepancy between your set temperature and the actual achieved temperature, especially when your system is running for long periods, can suggest airflow problems. This might be due to a dirty air filter, blocked vents, or leaky ductwork. Your Ecobee Home IQ, which tracks both set and actual temperatures, can be particularly useful here.
Filter Reminders and Maintenance
Many smart thermostats track actual run time and use this data to provide accurate filter change reminders. Instead of a generic monthly reminder, your thermostat tells you to change the filter based on actual usage, which is more precise. Ignoring these reminders can lead to reduced airflow, increased energy consumption, and strain on your HVAC system.
Regularly reviewing your how to read smart thermostat energy report data allows you to act on these alerts promptly, protecting your investment and maintaining efficiency. According to Energy Star, smart thermostats can save an average of 8% on heating and cooling costs, often by optimizing run times and reminding you of essential maintenance. For more information, visit Energy Star Smart Thermostats.
Leveraging Advanced Features for Greater Efficiency
Beyond basic scheduling, smart thermostats offer advanced features that integrate deeply with your energy reports to drive even greater efficiency. Understanding and utilizing these capabilities empowers you to automate savings without sacrificing comfort.
Learning Algorithms
Many smart thermostats, notably the Nest Learning Thermostat, learn your preferences over time. They observe your manual adjustments and build a self-optimizing schedule. Your energy reports demonstrate the effectiveness of this learning. You might see a reduction in manual adjustments and a more consistent, efficient schedule emerge as the thermostat learns your habits.
Geofencing and Presence Detection
Geofencing uses your smartphone’s location to determine if you are home or away, automatically adjusting temperatures. Your reports will show periods where the thermostat switched to “Away” mode, demonstrating how it saved energy by not heating or cooling an empty house. For example, if your Honeywell Home report shows significant “Away” time during work hours, you know your geofencing is actively contributing to savings.
Integration with Utility Programs
Many utility companies offer demand response programs where your smart thermostat slightly adjusts temperatures during peak energy demand periods. Your usage data may reflect these adjustments, showing how your participation in these programs reduces strain on the grid and often earns you rebates or credits. Check with your local utility for available programs.
Smart Vents and Zone Control
For homes with multiple smart vents, your thermostat’s reports become even more sophisticated. They can show how different zones in your home consume energy, allowing you to prioritize comfort in occupied rooms and minimize energy waste in unoccupied ones. This granular consumption analysis helps balance comfort and efficiency across your entire home.
The synergy between your thermostat’s data and these advanced features allows for a level of energy management previously unimaginable. You transition from simply controlling temperature to intelligently managing your entire home’s climate profile.
Optimizing Data Accuracy and Troubleshooting
To truly benefit from your thermostat’s energy reports, you need accurate data. Several factors can influence the reliability of your thermostat’s readings and subsequently, the quality of its reports. Addressing these ensures your understanding thermostat usage data is based on solid information.
Thermostat Placement
The location of your thermostat significantly impacts its readings. Placing it near a draft, direct sunlight, a heat source (like a lamp or appliance), or an exterior wall can skew temperature readings. This leads to inaccurate reports and inefficient system operation. Ensure your thermostat is on an interior wall, away from direct heat or cold sources, and at an appropriate height.
External Sensors
Many smart thermostats, especially Ecobee models, support external room sensors. These sensors provide a more accurate average temperature across different areas of your home. If your primary thermostat is in a hallway, but you spend most of your time in a living room, a sensor in the living room provides better data for your reports and improved comfort.
Calibration
Occasionally, a thermostat may need calibration. If you suspect your thermostat is reading temperatures incorrectly (e.g., it reports 72°F when another thermometer reads 75°F), consult your manual for calibration instructions or consider a factory reset. Consistent, accurate temperature readings are fundamental to useful consumption analysis.
Connectivity Issues
Your smart thermostat relies on a stable Wi-Fi connection to send data to the cloud for reporting. Intermittent Wi-Fi can lead to gaps in your usage data. Ensure your home network is reliable and your thermostat maintains a strong connection. A weak signal can also delay data updates and report generation.
By ensuring optimal placement, utilizing external sensors when available, checking calibration, and maintaining strong connectivity, you maximize the accuracy of your thermostat’s data. This allows you to trust the insights provided by your how to read smart thermostat energy report and make the most effective decisions for your home.
Frequently Asked Questions
What is the difference between run time and energy usage?
Run time measures the duration your HVAC system actively operated, typically in hours or minutes. Energy usage refers to the actual electricity or fuel consumed, often expressed in kWh or therms. While closely related, run time is a proxy for energy usage. Longer run times generally mean higher energy usage, but actual consumption depends on your system’s efficiency and power draw.
How often should I review my thermostat’s energy reports?
Reviewing your reports weekly or bi-weekly provides a good balance between identifying trends and reacting to recent changes. A monthly review is also beneficial for a broader perspective on seasonal consumption patterns. Check them more frequently if you are making significant changes to your schedule or testing new settings.
Can my energy report tell me if my HVAC system needs repair?
Yes, indirectly. Your energy report can highlight patterns that suggest a problem. For example, consistently increased run times without a corresponding change in outdoor temperature, frequent short cycling, or a significant difference between set and achieved temperatures can indicate inefficiencies or a developing issue. These patterns should prompt further investigation by a qualified HVAC technician.
Do all smart thermostats offer energy reporting?
Most popular smart thermostats from brands like Nest, Ecobee, and Honeywell offer some form of energy reporting or usage data. The depth and presentation of these reports vary significantly. Entry-level models might offer basic run time logs, while premium models provide detailed analytics and comparative data. Always check product specifications if energy reporting is a priority for you.
How accurate are the estimated energy savings in my reports?
Estimated energy savings provided by thermostat apps are typically based on proprietary algorithms that compare your usage against a baseline, often derived from historical data or averages of similar homes. While they offer a good directional indicator of potential savings, they are estimates. Your actual utility bill remains the definitive measure of your savings. Factors like insulation, window quality, and personal comfort preferences significantly influence real-world savings.


Leave a Reply